State Point Analysis
State Point Analysis
With just six data inputs, state point analysis (SPA) would seem to provide a simple mathematical model for evaluating clarifier performance. But in fact, the graphical output of SPA does require careful review and interpretation.

Before going through the specifics of SPA I’d like to quote from an excellent textbook (Mogens, Henze, et al. “Biological Wastewater Treatment: Principles, Modelling and Design.” London: IWA Publishing, 2008.) which identifies the shortcomings of SPA:
“State Point Analysis (SPA) is a convenient visual way to determine the operating condition of the clarifier. SPA is based on solids mass balances around the clarifier expressed graphically. The method inherently contains simplifications such as (i) it is based on steady-state conditions, (ii) only one (vertical) dimension is considered, no short-circuiting or the details of the sludge withdrawal mechanism is accounted for, (iii) effects such as compression are not considered, (iv) effluent solids are neglected. In spite of these simplifying assumptions, SPA is frequently used in predesign to establish clarifier area and return pump capacity, and in operation, to estimate maximum MLSS and required return flow settings before fine-tuning the plant’s operation based on actual performance.”
State point analysis can be used to model and evaluate secondary clarifier performance. Secondary clarifiers are evaluated based on two key categories consisting of the following parameters:
Hydraulic capacity (detention time, surface overflow rate [SOR], and weir overflow rate [WOR])
Solids loading capacity or solids loading rate (SLR)
Though the solids loading rate (SLR) is the most important design parameter for determining how well your secondary clarifiers are going to work, any one of these parameters might prove to be a constraint that ultimately limits clarifier performance. State point analysis is a (simplified) mathematical model that predicts secondary clarifier performance using actual operating data consisting of the following six data inputs:
Influent flow rate
Return activated sludge (RAS) flow rate
Mixed liquor suspended solids (MLSS) concentration
Clarifier surface area
Number of clarifiers in service
Sludge volume index (SVI)
The “state point” or the “operating point” is the point where the solids in the clarifier underflow rate line and the surface overflow rate line intersect. For stable operation of secondary clarifiers, loosely defined here as maintaining the sludge blanket at ≤3 feet, the state point must be located well below the settling flux curve. As the state point moves closer to the boundary line represented by the flux curve, it can be expected that the sludge blanket in the clarifier is increasing. This will be further indicated by the solids underflow line moving closer, or becoming tangent to, the settling flux curve. When the state point has moved outside, or above, the settling flux curve, loss of solids in the clarifier will likely be observed. (This paragraph will be repeated at the bottom of the last graph.)
In this graph all of the state point analysis curves are defined.

In this graph the solids flux axis (Y-axis) and the solids concentration axis (X-axis) are defined.

In this graph the operating point (state point) is defined.

Now the overflow rate operating line is identified.
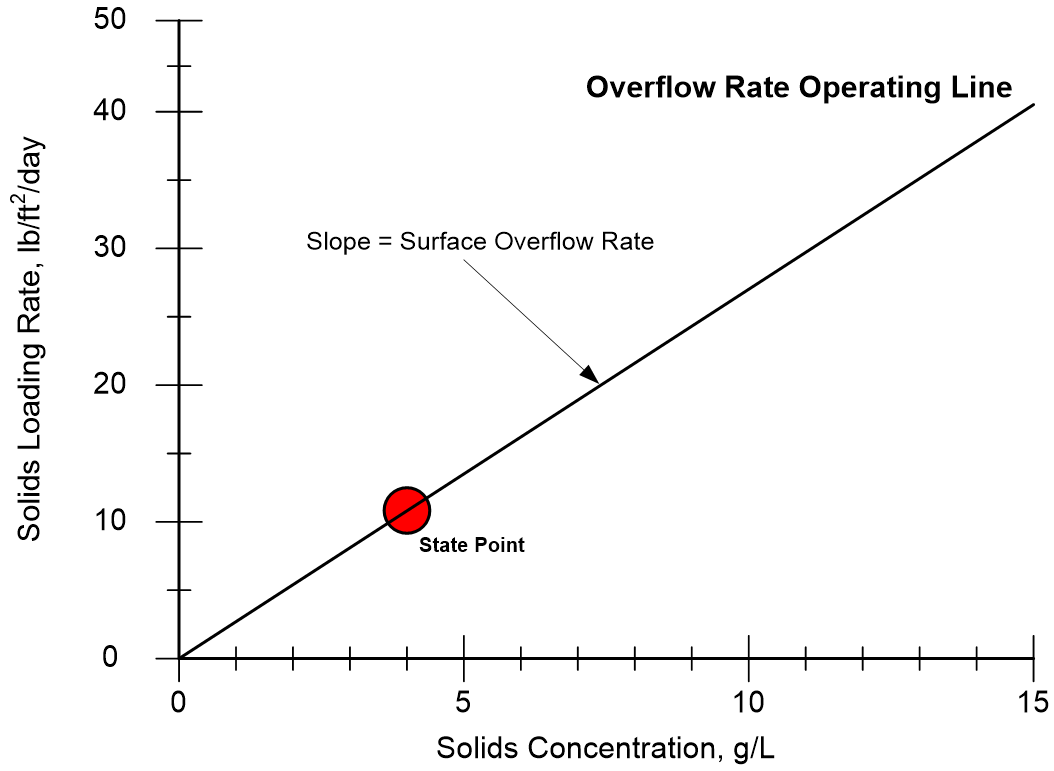
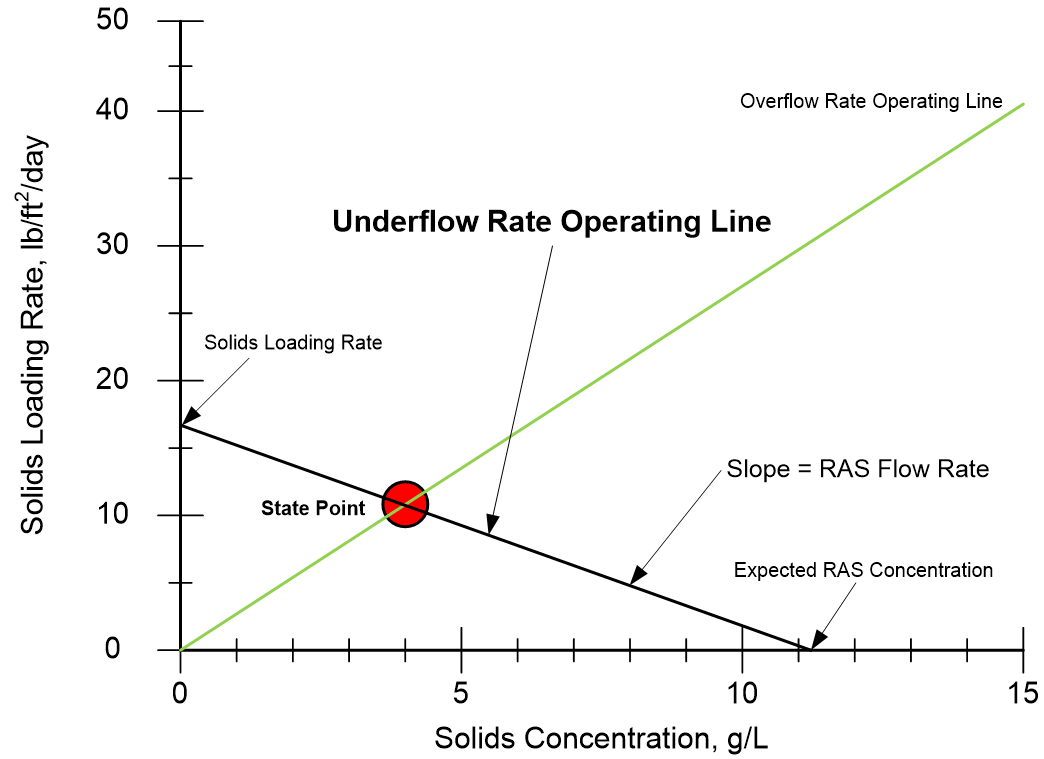
Here the underflow rate operating line is identified.
And finally, the settling curve itself is shown, with the state point well within its boundary.
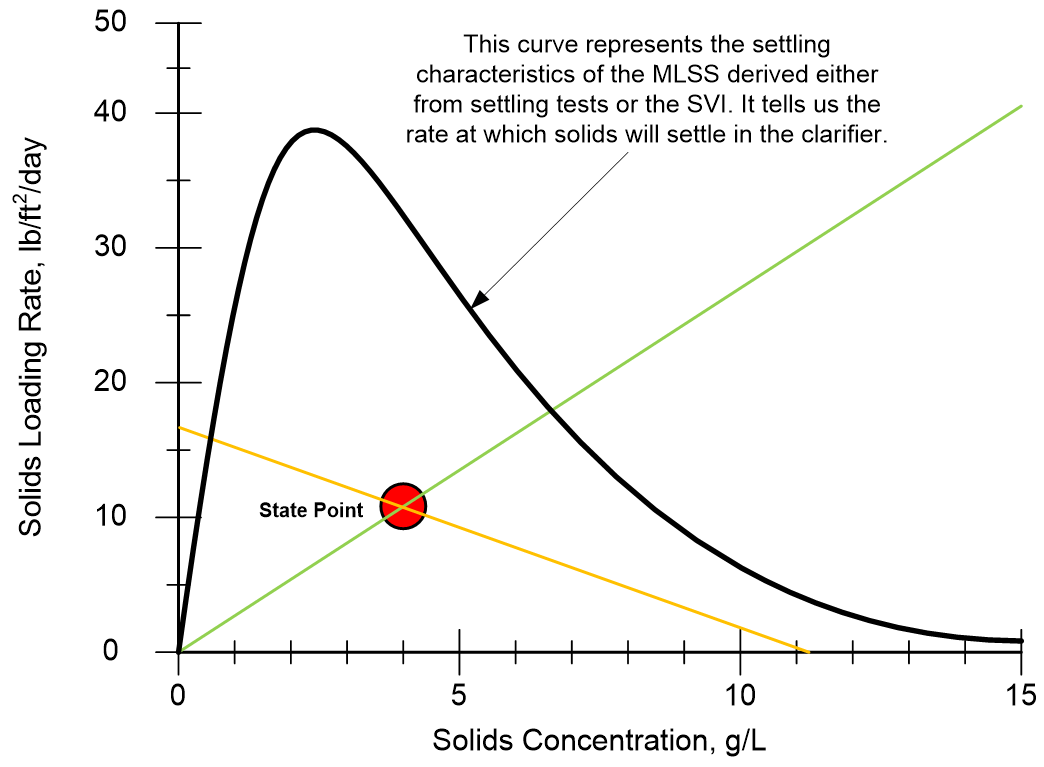
The “state point” or the “operating point” is the point where the solids in the clarifier underflow rate line and the surface overflow rate line intersect. For stable operation of secondary clarifiers, loosely defined here as maintaining the sludge blanket at ≤3 feet, the state point must be located well below the settling flux curve. As the state point moves closer to the boundary line represented by the flux curve, it can be expected that the sludge blanket in the clarifier is increasing. This will be further indicated by the solids underflow line moving closer, or becoming tangent to, the settling flux curve. When the state point has moved outside, or above, the settling flux curve, loss of solids in the clarifier will likely be observed.
One of the best articles I know of that does a great job of explaining and interpreting state point analysis can be found here. The paper is entitled "Design and Operation of Final Clarifiers" by Sam Jeyanayagam.
Determining the Sludge Volume Index
The Excel spreadsheet for doing state point analysis, which you can download here, provides you with four options for calculating the sludge volume index (SVI) value, the formula for which is shown below.

The four SVI calculation options in the State Point Analysis spreadsheet are described here.
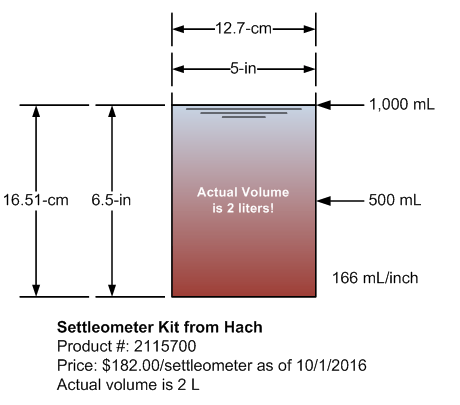
Option No. 1 is my preferred method. In determining the SVI you use a 2 liter settleometer without stirring (SVISN). That is, you are add mixed liquor to a beaker calibrated from 1 to 1,000 mLs that actually holds 2,000 mLs. The larger volume and shape of the settleometer (diameter x depth of beaker) is intended to more closely match the hydraulic behaviour of a clarifier.
In my opinion this method introduces the least amount of variability. With no mixing and no stirring you simply let the MLSS settle and calculate your SVI 30 minutes later. These settleometers do come with a paddle for stirring has shown in the photograph below. The intent is that you would gently lower the paddle into the settleometer and then even more gently and slowly stir to simulate the effect of a rakearm in a clarifier. Trying to do any of this introduces far too much variability and complexity to what should be a simple, 30-minute procedure.
2 Liter Settleometer Kit from Hach

Option No. 2 uses a 1 liter graduated cylinder without stirring (SVIGN). I don't like using graduated cylinders for determining the SVI. They are too narrow and too unlike the dimensions of a clarifier.
Option No. 3 uses a 1 liter graduated cylinder with stirring (SVIGS). How do you stir the contents of a tall, narrow, 1,000 mL cylinder??
Option No. 4 uses a 2 liter settleometer with stirring (SVISS).
Dimensions of the 2 Liter Settleometer from Hach
MLSS Sample Location for SVI and State Point Analysis
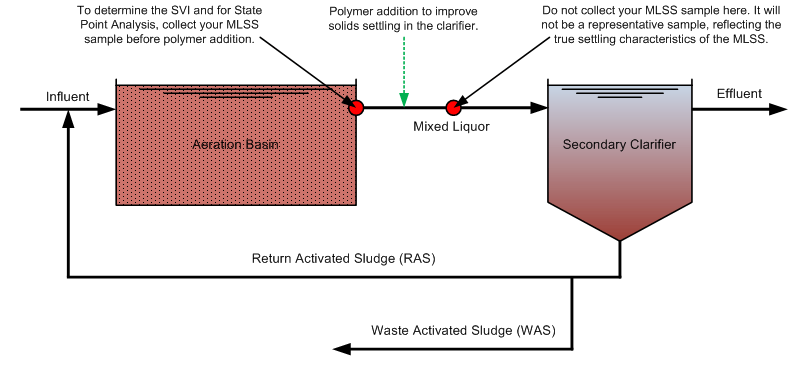
Many industrial wastewater systems, unlike municipal plants, need to add polymer just upstream of the secondary clarifier to improve solids settling. When you collect a mixed liquor sample to calculate the SVI or for doing state point analysis, you want to measure the SVI of the mixed liquor before the addition of polymer as indicated in the graphic below.
